In the realm of computer vision, the quality of your dataset can make or break the success of your model. A well-curated dataset is the foundation for developing accurate algorithms, robust models, and reliable systems. On the other hand, poor-quality data will inevitably lead to subpar results—no matter how sophisticated your model or algorithm is. As the saying goes, “garbage in, garbage out.”
When working with a dataset of videos or images, especially for tasks like model training, labeled data is often crucial. Typically, this involves having metadata files in formats like JSON, TXT, or YAML that provide essential details about each image or video frame.
But how do you efficiently filter and curate this data to build the best possible dataset? How can you leverage both labeled and raw images effectively?
The Challenges of Dataset Curation
Manually curating a dataset by writing custom code, generating tables, and creating visualizations can be a complex and time-consuming process. Moreover, when your team expands beyond a single individual, collaboration on data curation becomes increasingly difficult and inefficient.
Introducing Data Explorer: A Simpler Solution
Data Explorer is a powerful platform designed to simplify the process of dataset curation. It enables teams to focus on what truly matters—curating, cleaning, and optimizing data to ensure that development cycles start with a solid foundation.
Key Features of Data Explorer
- 2D Visualization: Visualize datasets on a 2D plot, automatically clustered into distinct classes for easier exploration.
- Cluster Exploration: Dive deep into each cluster and use image-based search to refine your dataset further.
- Metadata Filtering: Before visualizing, Data Explorer allows you to filter your data using a simple interface where all metadata is stored in a single table.
Filtering Data Using Metadata
The first step in effective dataset curation is filtering your data based on the available metadata. Data Explorer provides an intuitive interface where all relevant metadata—such as file names, detected classes, object bounding box coordinates, and confidence scores—is displayed in a table format.
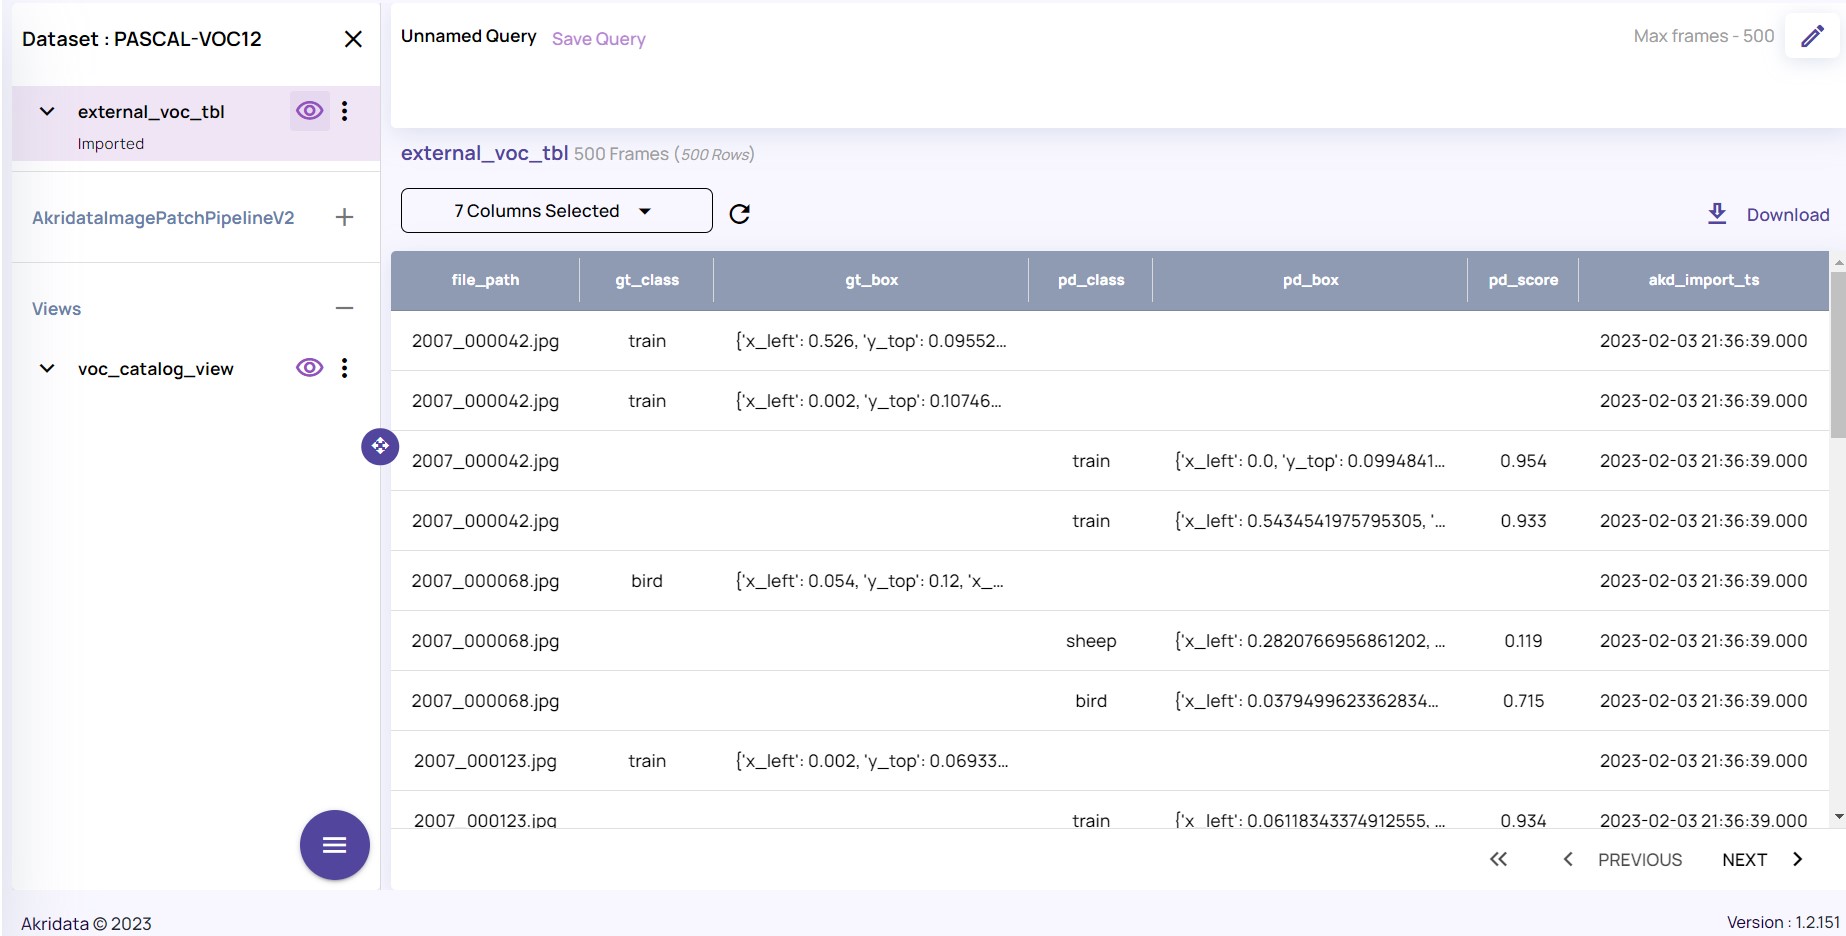
The image below illustrates the basic metadata visualization. On the right side, a table displays data for each image, while the left side allows you to define the frame range to process:

Metadata per image arranged in the table
This type of visualization lets you filter data using SQL-like queries based on any of the columns. For example, by clicking the “pencil” icon at the top right, you can set conditions to filter the dataset based on metadata such as object class or confidence score:

Click the “pencil” icon to filter the dataset based on metadata in any of the columns; On left— Define number of frames to process
Practical Example: Building a Bird Classifier Dataset
Consider the Pascal dataset, which contains natural images marked with various objects. Suppose you’re tasked with building a dataset specifically for training a bird classifier. Using Data Explorer, you can easily filter the dataset to include only images labeled with “bird.” This streamlined process saves time and ensures that your dataset is highly relevant to your specific task.
After filtering based on metadata, you can then visualize the structure of your curated dataset using Data Explorer’s powerful visualization tools. This allows you to continue refining and building the dataset required for your current task.
Summary: Streamlining Dataset Curation
In this blog, we’ve explored how to effectively filter data based on metadata and then visualize the selected images to build a robust dataset for model training. By using tools like Data Explorer, data scientists can streamline the curation process, ensuring that their algorithms, models, and systems are built on a strong data foundation.
Stay tuned for our next blog, where we will delve into working with labeled datasets and analyzing model training results.


No Responses