Introduction
Improving a model’s accuracy is a complex challenge, often leaving data scientists asking: where should resources be focused? The data-centric AI approach emphasizes the importance of data quality—by enhancing data where needed and targeting training cycles at a model’s weak points, accuracy can be significantly improved. But how do you identify these critical pain points?
Confusion matrices, precision-recall (P-R) curves, accuracy histograms, and other metrics are commonly used to assess a model’s performance. Each of these tools provides a different perspective on the model’s behavior and the data it processes, highlighting areas that may require attention.
Can We Go One Step Further? YES!
Modern Accuracy Analysis with Akridata
Akridata’s Data Explorer offers an interactive platform where accuracy metrics are directly linked to the data, saving valuable time in diagnosing model inaccuracies. This connection allows data science teams to precisely target their next training cycles on the areas where the model underperforms.
Optimizing for Classification, Object Detection, and Segmentation
Data Explorer is an AI platform designed to streamline visual data curation and reduce overall development costs. It provides researchers and data scientists with intuitive tools to manage their data, lowering annotation expenses and eliminating unnecessary training cycles.
For each computer vision domain—classification, object detection, and segmentation—Data Explorer offers interactive accuracy metrics controlled by relevant parameters, offering immediate insights into the underlying data.
IOU & Confidence Threshold: Key Definitions
IOU Threshold
When comparing two bounding boxes—typically the labeled and predicted—IOU (Intersection over Union) measures their similarity by dividing their intersection area by their combined area. This metric is also applicable to segmentation masks. Setting an IOU threshold allows the model to ignore predicted bounding boxes with low IOU values, enhancing accuracy.
Confidence Threshold
The Confidence Score represents the model’s certainty in its prediction. By setting a threshold on this parameter, predictions with low confidence can be filtered out, focusing only on those the model deems most reliable.
Data Explorer enables granular control over the IOU and Confidence thresholds, with a default uniform distribution across the [0, 1] range. Custom ranges can also be set to better suit specific use cases, providing flexibility in analysis. By default we get a uniform distribution across the [0, 1] range for either threshold, as seen below:
Uniform IOU and Confidence Threshold values.
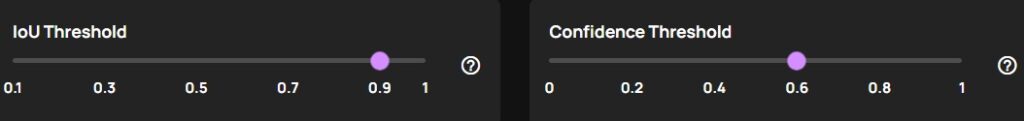
However, if a specific range is more suitable, that can be set, as seen below:
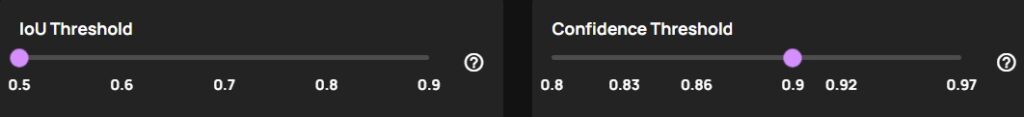
IOU and Confidence Threshold custom range & values.
Both thresholds are relevant for Object Detection and Segmentation problems, while for the Classification case only the Confidence Threshold plays a role.
Precision-Recall Curve: Balancing Precision and Recall
A Precision-Recall (PR) Curve illustrates the trade-off between precision and recall across different thresholds. This tool is particularly useful when prioritizing either the reduction of false positives or the maximization of true positives.
In Data Explorer, PR-Curves are available for each object, allowing data science teams to adjust thresholds and observe the impact on precision and recall values. Below is an example of a PR-Curve for the object “Bird,” showing how the curve’s shape is influenced by different threshold settings.
A PR-Curve for “Bird” is displayed below:
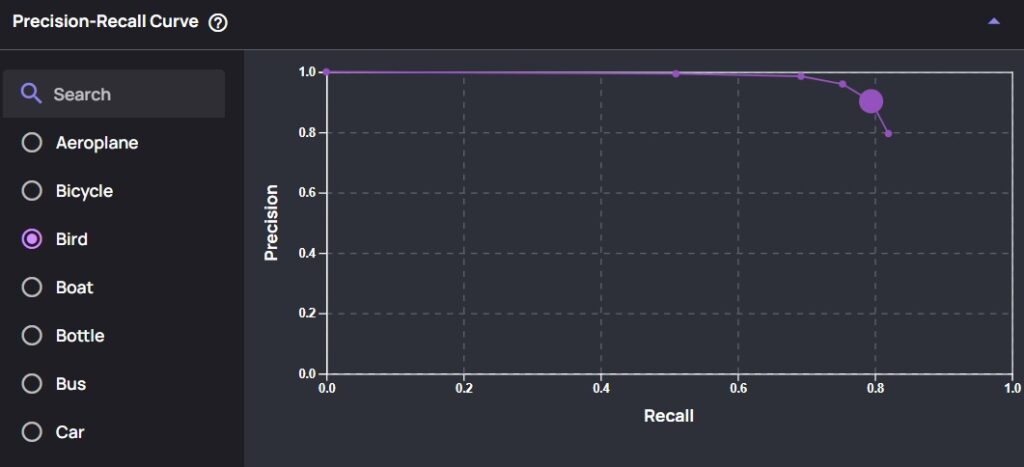
A PR-Curve for “Bird”, based on selected threshold.
A PR-Curve is provided for all problem types — Classification, Object Detection and Segmentation.
Confidence-IOU Histogram: A Deeper Dive into Accuracy
Another approach to analyzing model accuracy is the Confidence-IOU Histogram. This tool displays the number of elements in specific confidence and IOU ranges, providing a visual representation of the model’s performance.
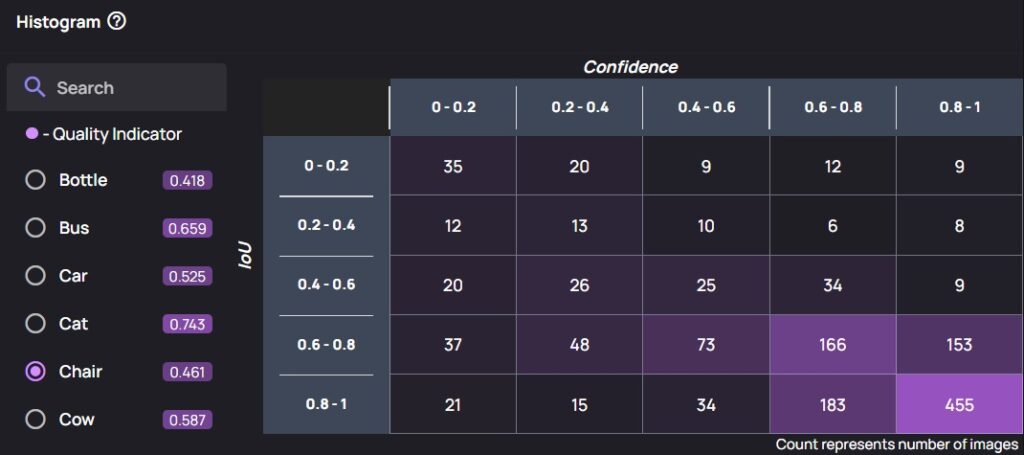
Confidence-IOU Histogram. Each cell is linked to the images.
Examples in the top left corner may flush-out a problem — a model’s output with high confidence, but a low IOU might indicate a serious accuracy concern, or an error on the labeling part. Below is an example that demonstrates this — top right cell of the histogram contains four instances of model predictions with a high Confidence score (> 0.8), while a very low IOU with labeled data (< 0.2).
When the images related to the cell are viewed, each shows examples of missing labels, as seen on the right of the image.
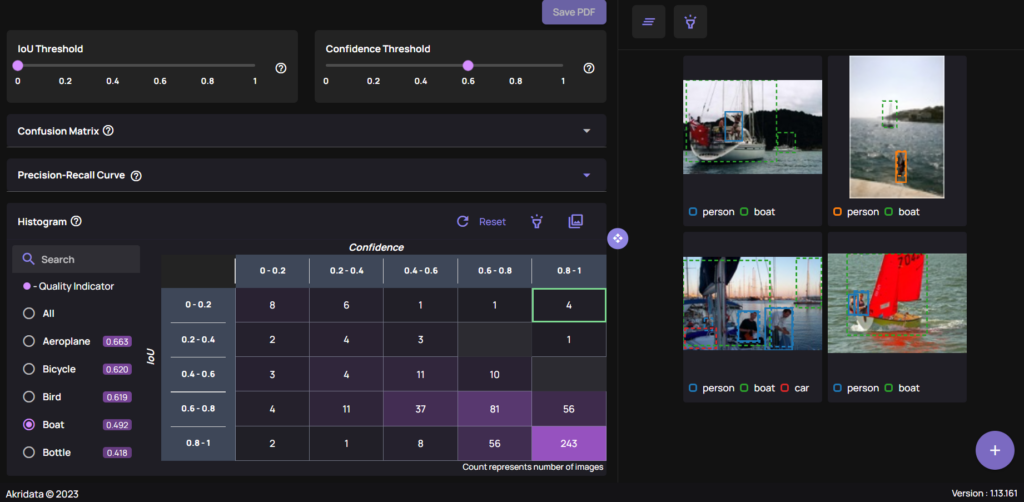
(Left) Top right of Confidence-IOU histogram contains examples of model predictions with high Confidence but low IOU. (Right) The corresponding images to the cell all contain missing labels.
A Confidence-IOU histogram is provided for Object Detection and Segmentation problems, while in the Classification case, a bar plot of Confidence vs Number of Samples is shown. As seen below, the bar plot is shown per class, and similar to the histogram above, each bin provides direct access to the images:
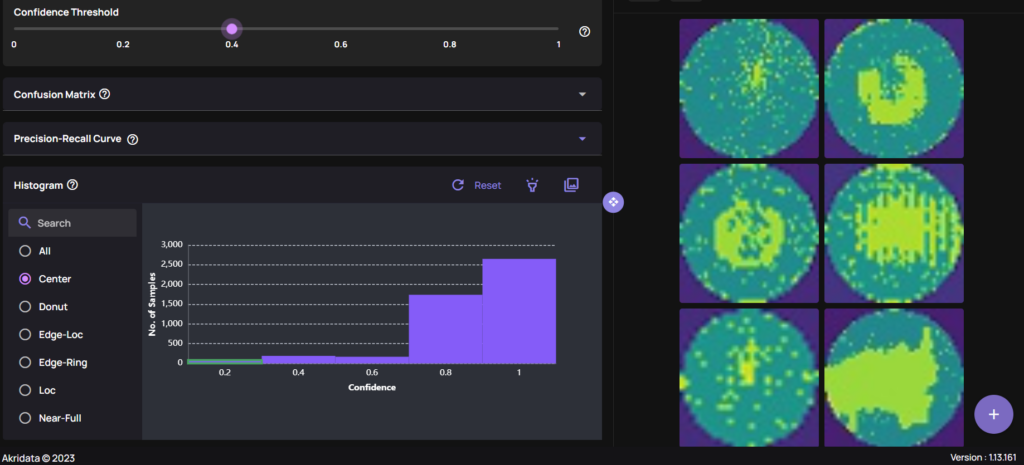
Classification problem: Bar plot of Confidence vs Number of Samples. Each bin is linked to the images.
Confusion Matrix: Visualizing Accuracy
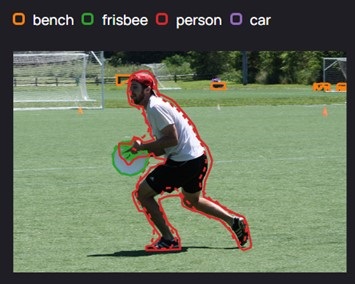
A Confusion Matrix visually represents a model’s accuracy by counting correct and incorrect predictions based on set IOU and Confidence thresholds. In Data Explorer, each cell in the confusion matrix is clickable, providing direct access to the instances it represents. This interactivity allows immediate feedback on model and labeling accuracy.
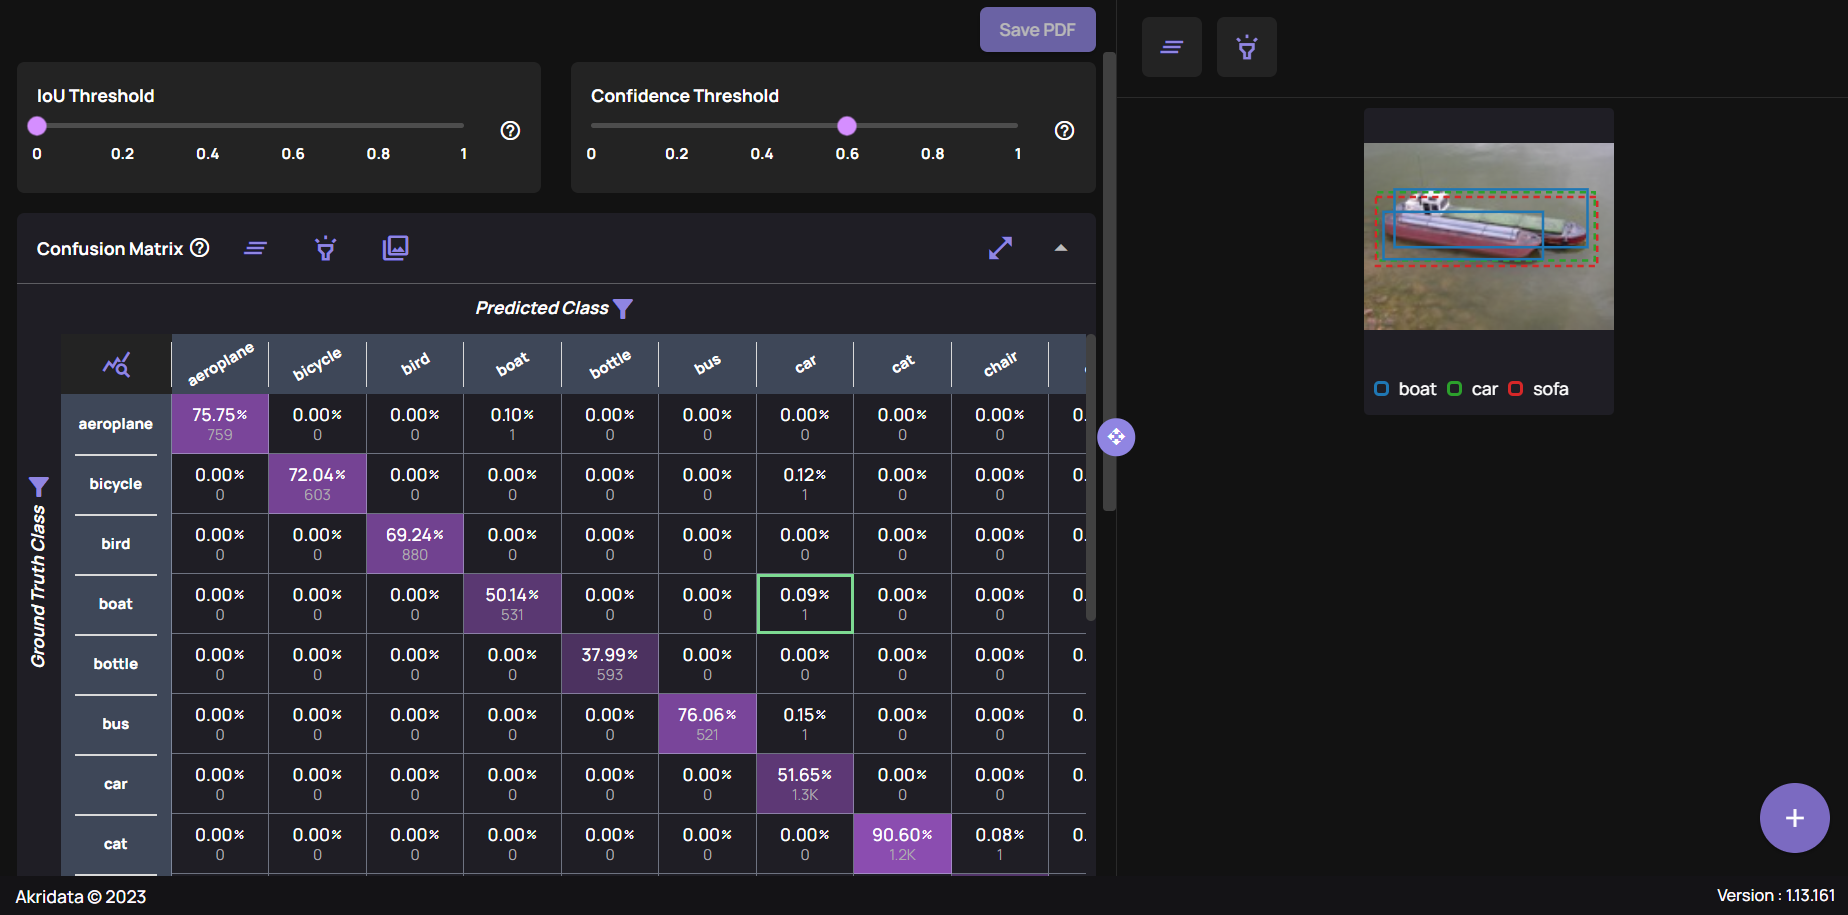
As with the histogram above, each cell in the confusion matrix can be clicked to view the instances it represents, providing direct feedback on model and labeling accuracy. In the example below, a combination of the thresholds, the confusion matrix and a cell’s content are visible, for an Object Detection case:

(Left) IOU & Confidence Thresholds with the Confusion matrix. (Right) The highlighted cell’s content.
A confusion matrix is provided for all problem types — Classification, Object Detection and Segmentation.
Segmentation Mask Analysis
While the confusion matrix example above applies to object detection, Data Explorer also supports segmentation masks. The platform provides a similar level of interactivity, allowing users to explore segmentation masks and their associated classes.
While the Confusion Matrix above shows an example for an Object Detection type, Segmentation masks are visible too, in similar fashion, as on the image below:
Segmentation masks and their classes.
Summary
In this blog, we explored how Akridata’s Data Explorer takes model accuracy analysis to the next level through interactivity, bridging the gap between statistical results and the underlying data.
By combining these tools, Data Explorer saves researchers and data science teams countless hours on result analysis, directing the next training cycle precisely where the model needs improvement. Ultimately, this approach lowers development costs and shortens the overall development timeline.
For a demo of Akridata Data Explorer, contact us here. Visit us at akridata.ai or click here to register for a free account.


No Responses