Manually sifting through 1,000 images is tricky, but what about 1,000,000?
What if we get a new batch of 10,000 images every day?
Many who work on various computer vision tasks face a similar challenge. Akridata Data Explorer is a unique and powerful tool for data curation. Curating and exploring your database is the first step to having a clean database, which can be used for model training and testing.
In this post, we’ll examine how Akridata Data Explorer is used to explore the nuScenes dataset.
nuScenes is a public large-scale dataset for autonomous driving. It contains tens of thousands of images, captured during different conditions, making the dataset a great example of a ‘real-life’ database. In this case study, it will be treated as a single batch, with no prior knowledge of what it may contain.
Visualizing the nuScenes Dataset with Akridata Data Explorer
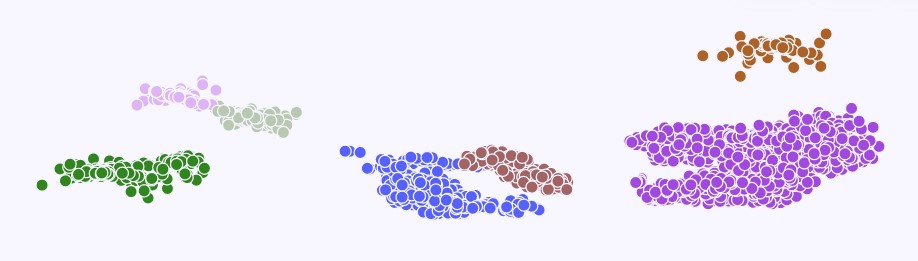
With Data Explorer, database exploration starts with analyzing each image and ends with a 2D point cloud in some feature space.The visualization step of the nuScene dataset results in the cluster map shown below
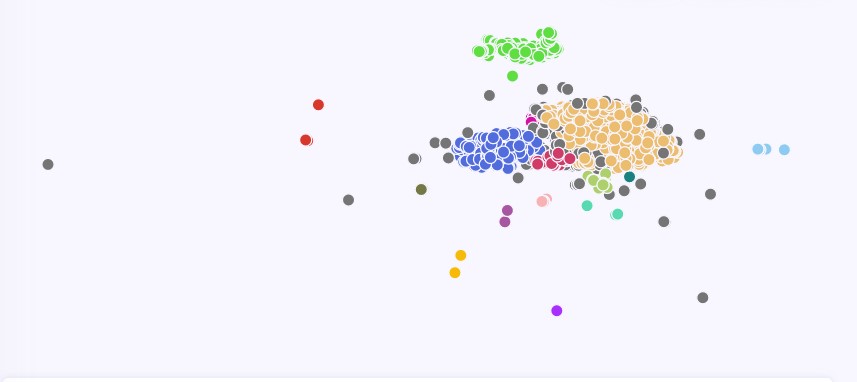
Each dot represents a group of images, where a cluster of dots indicates images with similar characteristics and latent structures, while outliers represent images different to the main mass. In addition, the colored clusters that are more positioned more closely together will contain images that are more closely related.
Data Explorer allows us to follow different exploration paths, two will be shortly reviewed in this post:
- An outlier inspection from up close.
- A deep dive into a large cluster.
Inspecting Outliers in the nuScenes Dataset
By clicking on the left-most dot, we see what type of scene it represents:
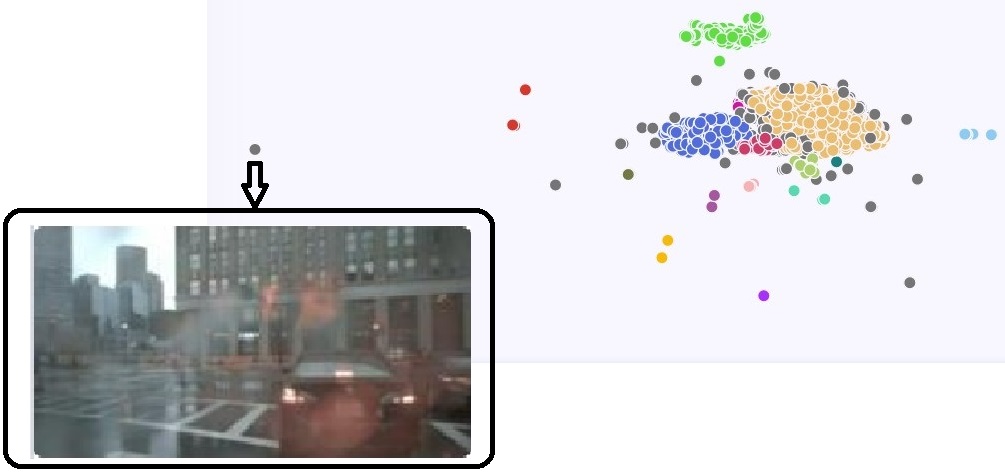
As mentioned above, each dot can represent more than one image. The above outlier class contains many similar images, nine of which are displayed below:

With Data Explorer this set of images can be subsampled or taken as a whole, depending on the application, for the next step in the data processing.In a similar fashion, each cluster can generate a subset of images to be used for training or testing purposes.
Analyzing Clusters in the nuScenes Dataset
In the previous section, the outlier represented a very specific scene. It is interesting to explore what one of the bigger clusters holds inside. The green cluster at the top of the 2D map clearly represents a big chunk of the images:
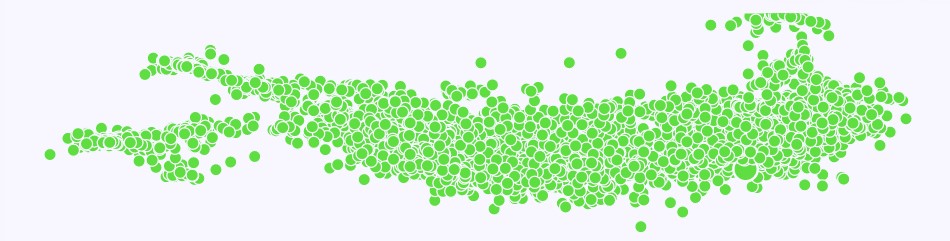
By manually looking at some of the images, they all appear to be captured during the night, with very little illumination. As such, the cluster can be marked as ‘Night’ and treated separately from the others.
In addition, further review shows different subclasses. For example:
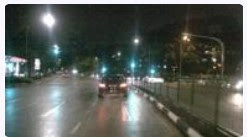


The three images represent different night subclasses, which then leads to the option of splitting the cluster into several subclusters.
Determining the Optimal Number of Subclusters
Remember – we assume no prior knowledge about the images in the nuScene database, so choosing seven is as good as any.
The resulting map is shown below:
Evaluating the Subcluster Choices
Two pairs that might be merged indicate that maybe five was enough, but Data Explorer is the tool that stops us from guessing, and lets us check.
Below, an example for each class was manually added to the cluster map. Indeed, a split into five clusters would be sufficient in this case.
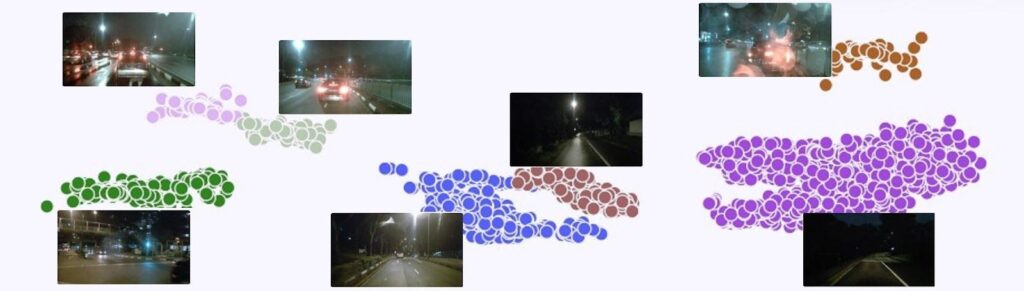
Each resulting subset can be saved separately and used later in the flow. Naturally, this process can be repeated for each of the major clusters from the original map.
Summary
In summary, Akridata Data Explorer is an invaluable tool for managing and curating large image datasets. By visualizing and categorizing data into meaningful clusters, it simplifies the task of database exploration, making it easier to identify outliers and understand the dataset’s structure. Whether you’re working with autonomous driving datasets like nuScenes or other complex image databases, Akridata Data Explorer can enhance your data curation process, leading to more efficient and effective model training. Explore Akridata Data Explorer today and transform how you handle big data.
In future posts, more capabilities of Data Explorer will be demonstrated.


No Responses