Information can be presented in many different forms – starting from its raw format, with no processing or filtering, through graphs and statistics, to a short summary or even a single value.
It all depends on the use case, available resources and the next step. Choosing the correct form of data presentation is tricky, but when done correctly, leads to a better decision making process.
Visual data is no different, and when developing applications based on it, the way we deal with it, represent it and curate it could be the difference between a failed and a successful solution. Which would you choose – a classification model that was trained on a messy, poorly labeled dataset, or one that was trained on clean data with quality labels?
It’s a simple decision to choose the one based on clean data and quality labels, but they are hard to come by.
Curating a well balanced, clean dataset of images or videos is a very tricky and time consuming process, one that requires the relevant platforms and tools, such as the one Akidata provides in the form of Data Explorer.
Data Explorer saves hours on visual data curation, starting by visualizing a dataset for quick outlier identification, accurate image or text based search for selecting a training set, analyzing a trained model’s accuracy and much more.
On top of that, annotating a database is costly and may result in errors. Errors within the labeling data are just as bad as using the wrong images or low quality videos to train a DL model.
Data Explorer’s Attribute Visualization
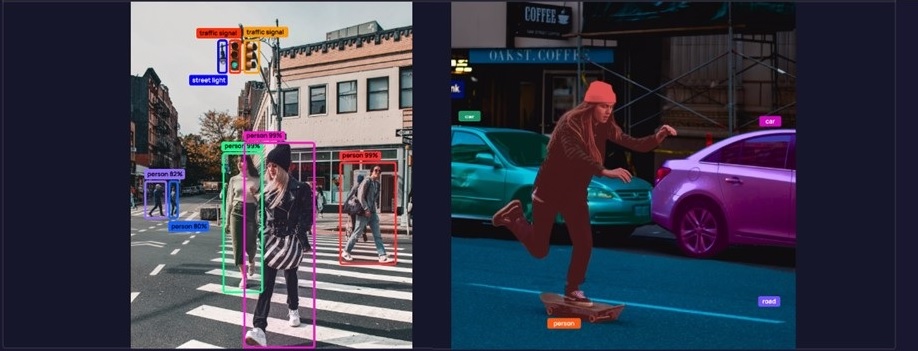
Label data could be provided in various forms – image tags or classes, bounding boxes, and of course, segmentation masks.
It can also come from different sources – ground truth from an expert in their field, output from a labeling process or the result of another DL model. It is useful to visualize the label information with the data itself – whether to confirm the quality of labels used as ground truth or to have a glimpse at how well the model is performing.
Data Explorer can display tags or classes next to image, overlay bounding boxes with their classes and of course add masks to images or video frames.
Generate Custom Attributes
If only partial label information is available, alongside a model, Data Explorer supports custom attribute generation – you can run your custom model on your data, generate new label information and visualize it too.
This enables you to compare model performances, enrich your label information, train a new DL model or test an existing one – all using a single platform!
Get started with Data Explorer
Data Explorer extends fast and accurate raw data curation with attribute generation and visualization. Visualize existing tags, bounding boxes or segmentation masks, generate new ones and combine it all under a single platform.
To learn more, visit us at akridata.ai or register for a free account.


No Responses