Introduction
A dataset of images, used for computer vision tasks, could be the key to success or failure. A clean dataset could lead the way to a great algorithm, model and ultimately system, while no matter how good the model or algorithm is, garbage in – garbage out.
So how do you make sure your algorithm and model are based on strong foundations, i.e. a clean, high quality, dataset?
Data Explorer is a platform that was built to allow us focus on the data, curate it, clean it and make sure we start the development cycles with a great foundation. In a previous blog, we saw how a dataset could be visualized using Data Explorer. Visualization is just the first step, the second being: Exploration.
Let’s get straight to it.
Image Data Set Exploration
1. Sanity Check
The first check could be considered as a sanity check — randomly chose a few images from the data and visually confirm they are as expected.
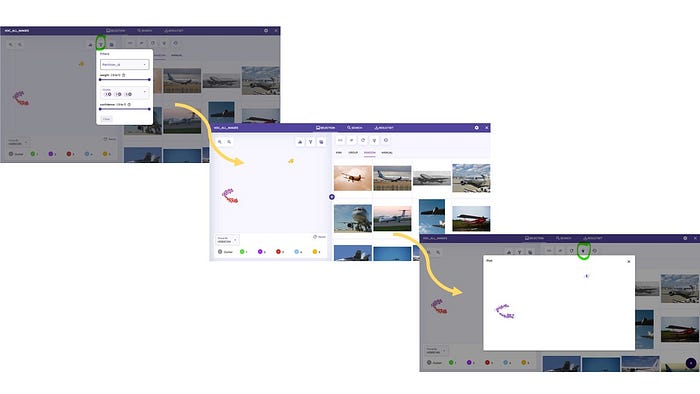
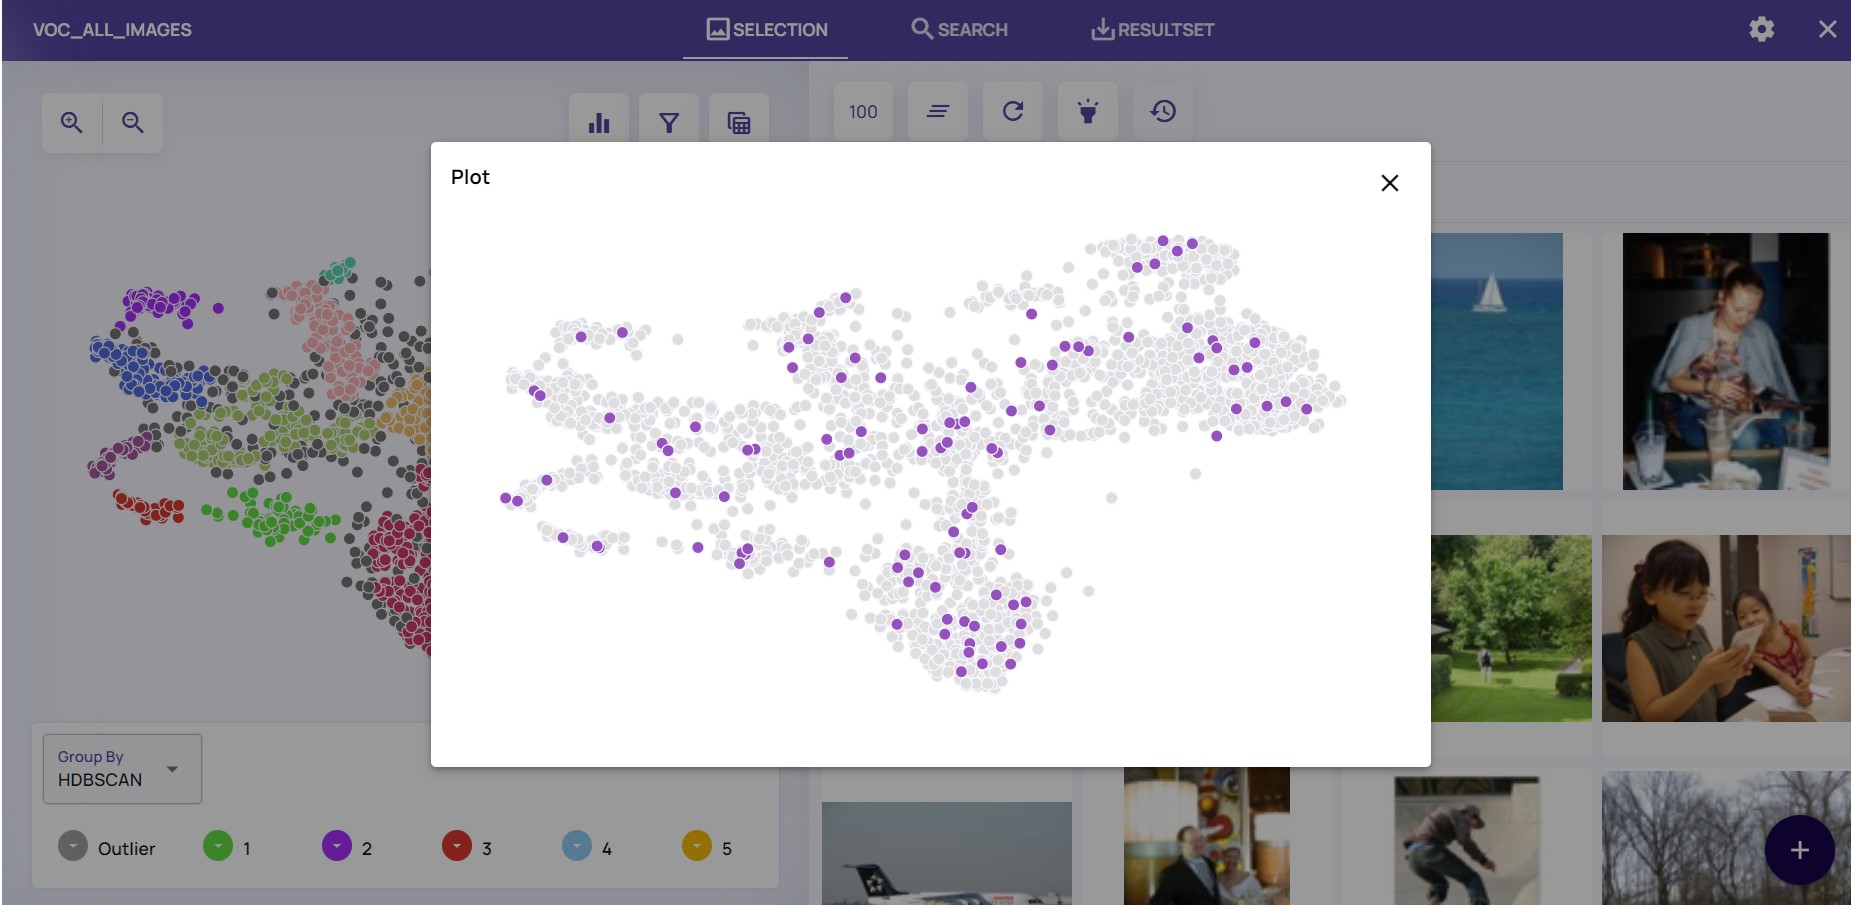
I’ll continue the example form the previous blog, demonstrating on the Pascal VOC dataset. In the image below, the dataset is visualized on as a 2D map (right), and randomly selected images are displayed (left). If we press the “flashlight” icon, we can see the random images’ locations on the full map.

Left: Pascal VOC dataset visualized + randomly selected images. Highlighted “Flashlight” icon pressed. Right: Random images’ locations highlighted
2. Cluster Review
The second check, could be reviewing the clusters and what they hold. You could start by choosing “Group” (to the left of “Random”), clicking on an image from a cluster will show images from that cluster. Below we check the Red cluster, and see these are all air-related images (planes, birds on the sky, etc).
Note: Processing is done on raw image level — no metadata and no prior knowledge.

“Group” option allows you to view examples from a single cluster. Red cluster is chosen
While a cluster could be very large, we can view at a small number of examples around a single, chosen image. Click on the “knn” option, choose a single dot and view images around — as seen below:

View a few images around a chosen point using the “knn” option
3. Further Cluster Exploration
The first two steps were a sanity check and brought some understanding about each cluster. Further review of a single, or multiple clusters, could be easily done. Below, we see how 3 clusters were chosen and random images from just these 3 are visible:

Left to Right: filter clusters to view and display images from those clusters only
The above interaction allows you remove whole chunks of undesired clusters of images, while keeping only those required for development of the algorithm, model training and overall system.
We could also notice that some clusters are bigger and some are smaller — a clear indication of potential class imbalance (more on that in a future blog).
How else could Data Explorer help with data curation?
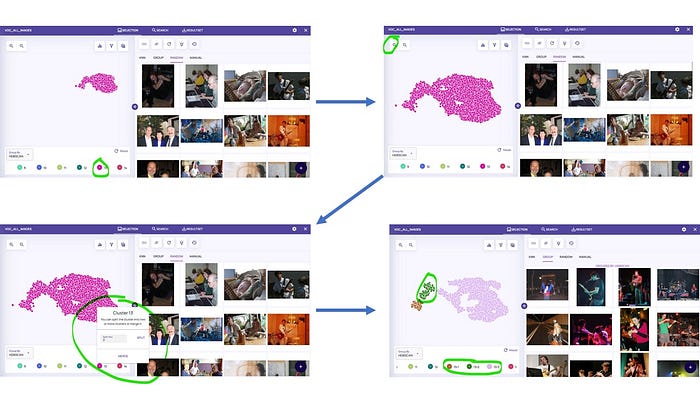
A cluster is a group of images that are different from other images. Data Explorer automatically decides on the number of cluster, but in some cases, further exploration might lead to the conclusion that a cluster should be split even further. In the example below, we see how one of the clusters was split into 3, each could be evaluated further.

Top left, following arrows: choose a cluster, zoom in on it and split into 2, 3, or more clusters.
As an example, the NuScenes dataset was explored in similar fashion — read more here.
Summary
What have we achieved thus far?
- By seeing the dataset structure we could identify potential cases for cluster imbalance.
- Exploring the different clusters allowed us to remove unwanted whole clusters of images that could be irrelevant.
We now have a clearer understanding of the dataset and what it holds. In the next two blogs, we continue to refine the dataset needed for our development work by two mutually completing means: sampling the data and image based search.


No Responses