Data Explorer is a data-centric AI platform for visual data and can help with every stage of AI model development, e.g.
- Data: Eliminate redundancies in datasets
- Training results: Root cause model failures to improve model accuracy
- Deployment analysis: Identify anomalies in data consumed by deployed models
Data Explorer can also be used for Kaggle competitions. To demonstrate this, we chose the RSNA Screening Mammography for Breast Cancer competition – a good candidate since it uses visual data (images or video).
This blog shows how to:
-
Import the RSNA Mammography dataset into Data Explorer
-
Do some initial Exploratory Data Analysis (EDA)
-
Perform coreset selection for faster iteration
1. Import the RSNA Mammogram Dataset
Go to the Akridata Data Explorer web page and select Get Started > Try Data Explorer Now. Once you’ve registered go ahead and log in.
Akridata Data Explorer has already imported the RSNA Mammography dataset. To add it to your datasets, just click on Import public dataset > Kaggle-RSNA-Mammography. This will take a few minutes to complete.

You can explore the dataset’s metadata by clicking on it’s Catalog icon:

From here you can run queries against the dataset table (corresponding to the mammogram images) and the metadata table (from the train.csv file). The metadata from the train.csv file includes attributes such as image orientation and tissue density, which will be useful later on when we’re exploring the images. You can read about the additional catalog functions here.
You can always return to your datasets with Left-hand sidebar > Data > Repo > Datasets.
2. Visualize the RSNA Mammogram Dataset (Initial EDA)
To visualize a dataset, you need to create a visualization job from the dataset:
-
Click on the rsna_catalog_view eye icon to run its default query
-
Click on the pencil icon to edit the query to include all frames (images) and run it again
-
Click on Visualize and give the job a name (just use defaults for the remaining values).
See Job creation and visualization for more additional information.

After a few minutes, view your job by selecting Left-hand Sidebar > Data > Curate > Jobs and then click Visualize.


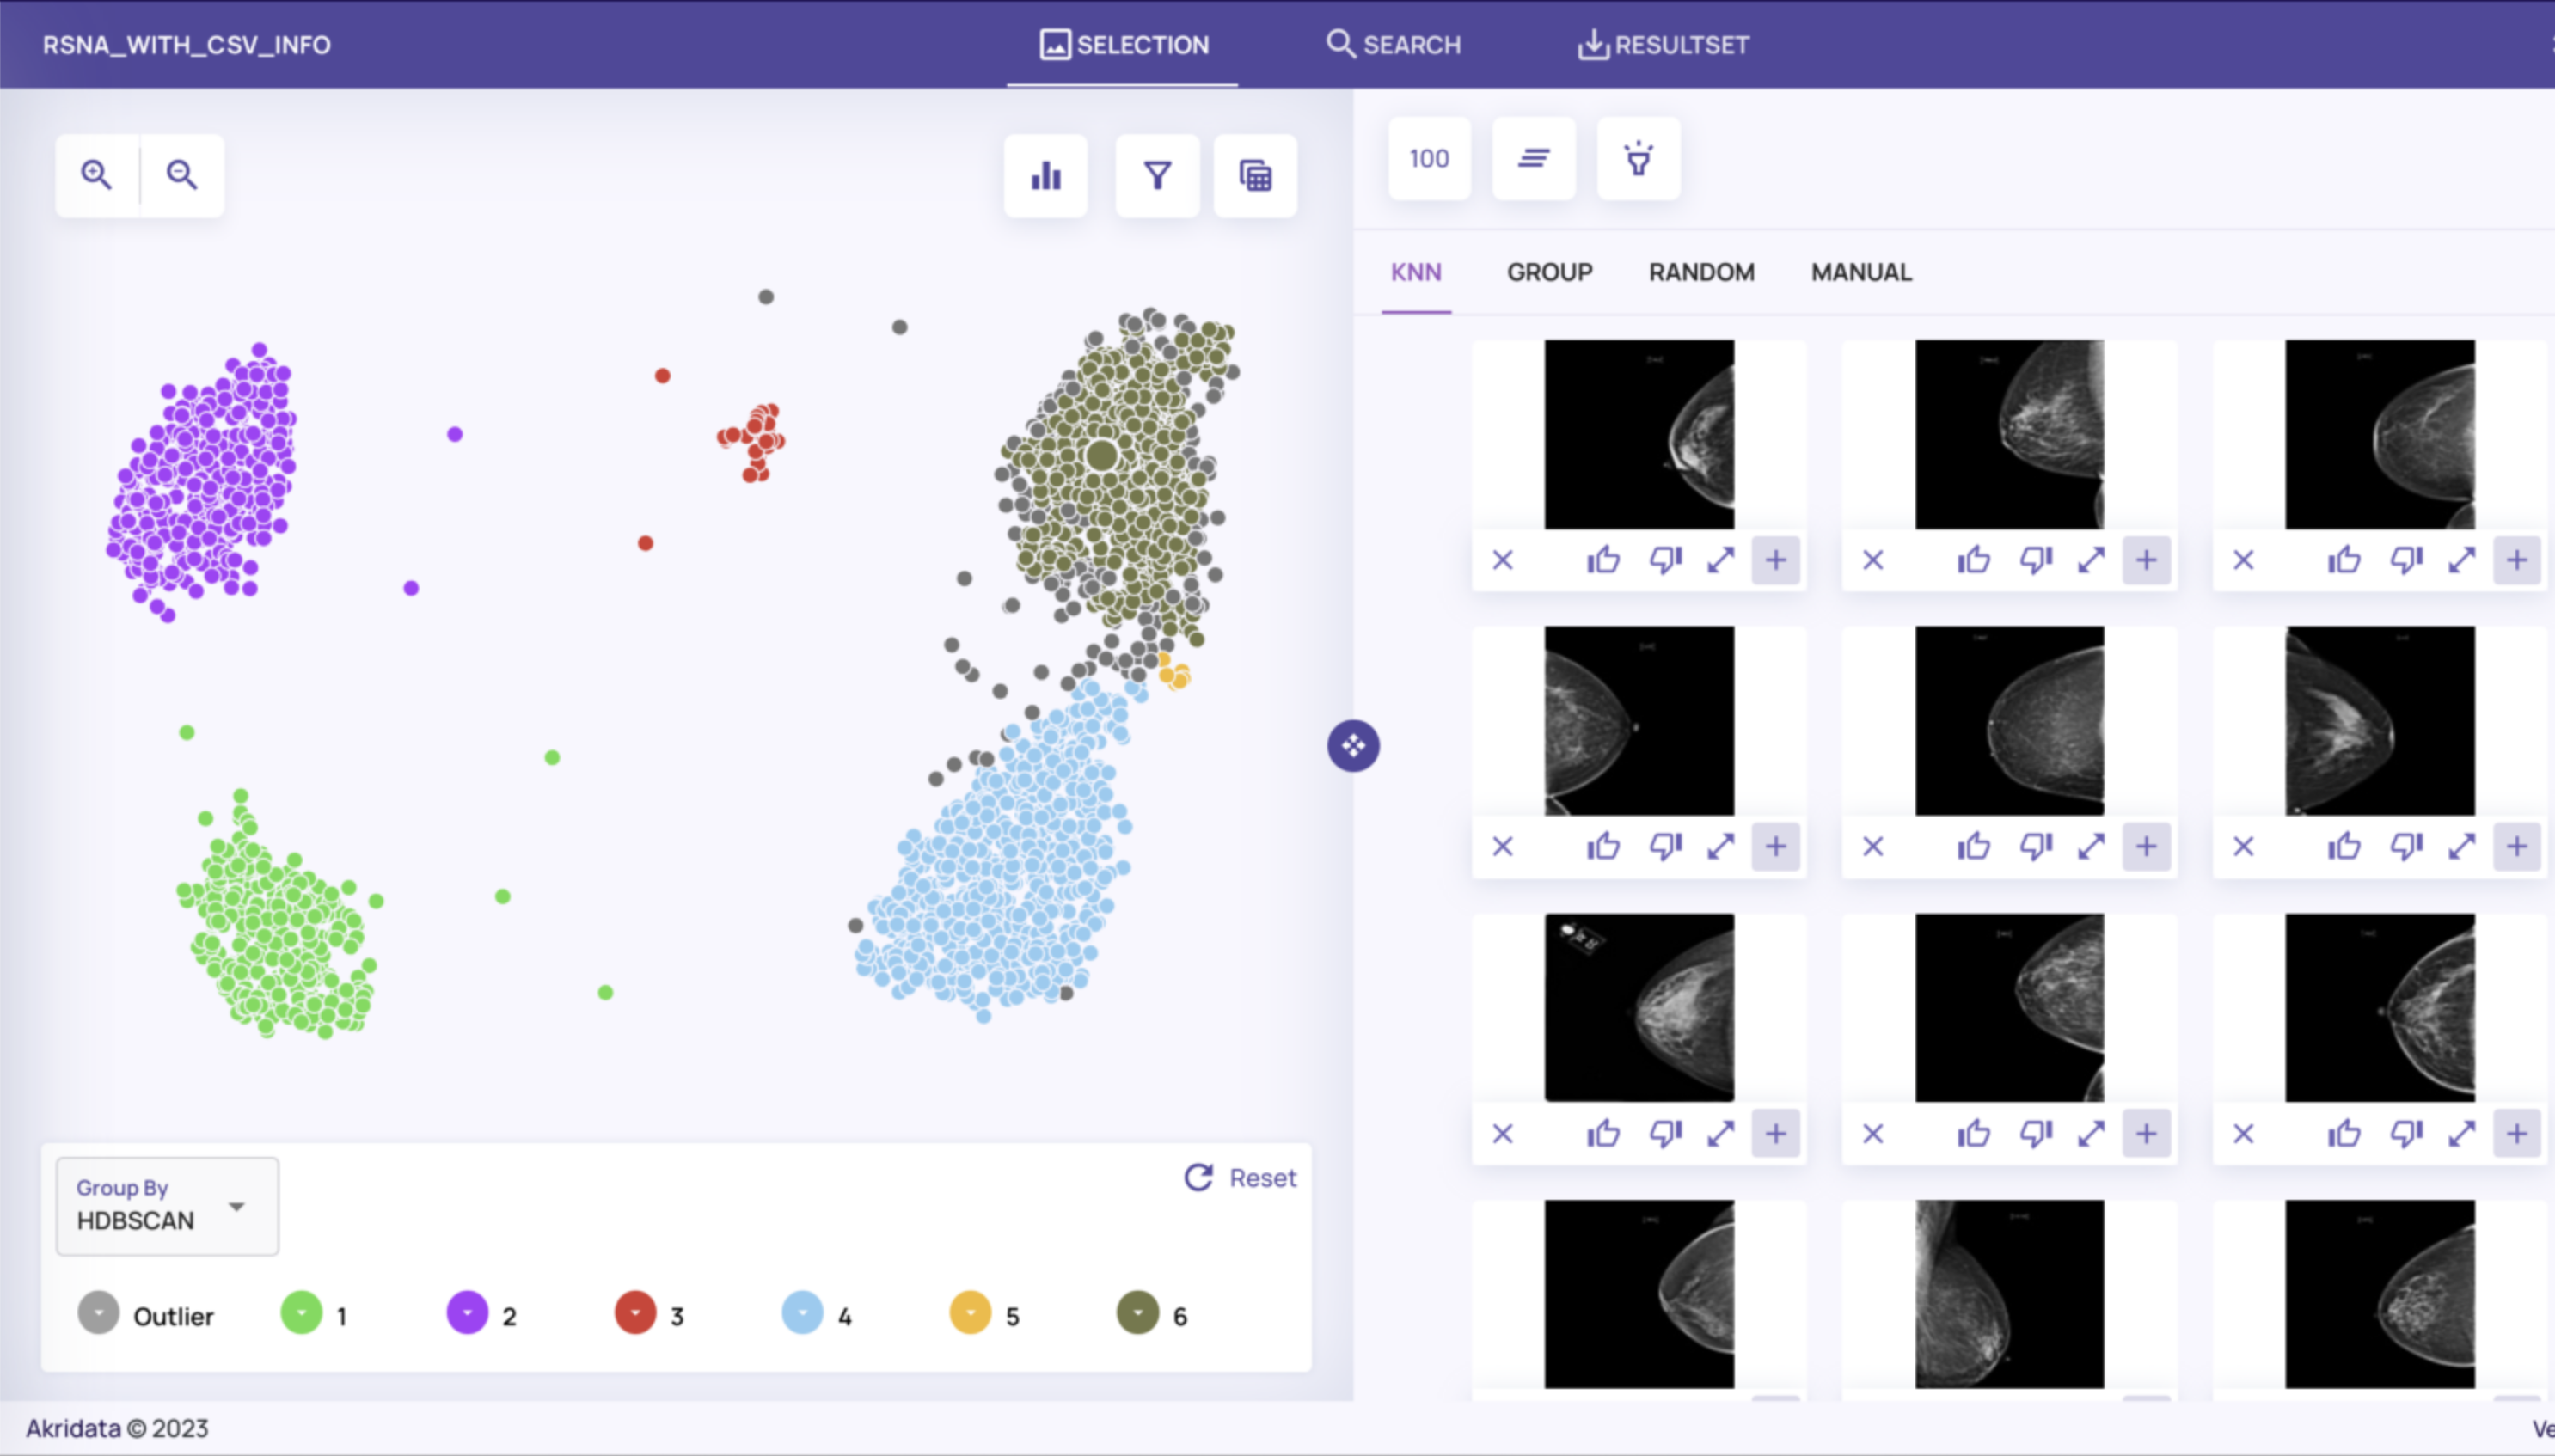
On the left side of the screen, you’ll see a plot view of the dataset which is the result of running Data Explorer’s featurizer followed by an embedding algorithm (UMAP by default) and a clustering algorithm (HDBSCAN by default).
You can inspect the images corresponding to the data points by selecting a data point and viewing the K-nearest neighbors, members of the cluster group, a uniform random sample, or by manually selecting a specific image. Change the sample size to increase or decrease the number of images selected and displayed.

From here, we can start characterizing the dataset, based on the clustering and the metadata associated with them. For example, images from the top two clusters appear to be taken from the top with the camera facing downwards. Indeed, inspecting the metadata corresponding to these two clusters shows they have Cranial Caudal views (metadata for an image is accessed by selecting its full-resolution image and toggling Show Catalog Tags – see Job creation and visualization for more details on how to do this).


Similarly the lower left and lower right clusters have Mediolateral Oblique views (taken from the side):


The small cluster in the upper middle contains implants (which can be seen visually by the white circles), while the small cluster in the middle right appears to have lower tissue density.


You can explore the dataset in a number of other ways, e.g. change the number of clusters, sample a fraction of the data, highlight the outliers. You can also filter the data based on metadata, for example, if you only want to see images with a Cranial Caudal view: Catalog Filters > rsna_train_view = CC > Submit Query, resulting in a filtered plot view.:


This confirms our earlier observation that the top two clusters primarily consist of CC views.
You also might be curious to compare images with cancer to those without cancer. To do this do Catalog Filters > cancer Equals 1 > Submit Query and Catalog Filters > cancer Equal 0 > Submit query. Then you can compare the two sets of images.


3. Perform Coreset Selection for Faster Iteration
Data Explorer can also be used for faster iteration while training models by utilizing it’s coreset selection feature. A coreset retains the most useful images while eliminating the most similar, redundant images. By choosing the most useful 1% of the images, you can train your model 100x faster while you experiment with model design, hyperparameters, etc. Once you’re done iterating, use the full dataset and train your model to its highest accuracy.
In the upper right corner of the cluster diagram, select Tunables. Then switch the sampling mode to Coreset, the Sampling Fraction to 1%, and click Submit.


This uses a coreset algorithm to select the most useful 1% of the data (547 images). Create a Result Set with these images by setting the Sample Size to 1000 and clicking on the ⊕ symbol in the bottom right corner > All 547 Points > Create New > and give it a name. Then select RESULTSET in the top menu and click Publish. View the Result Set by clicking on Left-hand sidebar > Data> Curate > Result Sets. See ResultSets for details on how to dump the dataset into a format you then use for training.
Conclusion
We’ve shown how to use Data Explorer to help with the Kaggle RSNA Mammography competition, both with to do EDA as well as perform coreset selection for fast iteration. Data Explorer has many other powerful features, e.g. iterative image-based-search, confusion matrices, precision-recall curves. Feel free to try out it for yourself, and see how Data Explorer can help you analyze your data and improve your model.


No Responses